01 / PREPARE
The right surface for the question
Thin sections, polished sections and SEM preparations are selected for the material and analytical objective. Core, sidewall core and cuttings can be considered, subject to suitability.
 SUBSURFACE ANALYSIS
CHARACTERISE / SERVICE 05
Thin-section and electron-microscopy observations help explain mineral textures, diagenesis and relationships between rock fabric and pore structure.
THE QUESTION
Microscopic observations put bulk measurements into context. Targeted samples help investigate why apparently similar rocks behave differently and identify where further work would be useful.
CONNECTED ANALYTICAL METHODS
01 / PREPARE
Thin sections, polished sections and SEM preparations are selected for the material and analytical objective. Core, sidewall core and cuttings can be considered, subject to suitability.
02 / EXAMINE
Combine optical petrography with SEM, backscattered-electron imaging and cathodoluminescence where appropriate. FTIR adds complementary mineralogical information. Document the features that help explain the wider measurements.
03 / MAP
QEMSCAN combines electron microscopy and energy-dispersive spectroscopy to produce mineralogical maps. Read the mapped distribution alongside composition and textural observations.
04 / INTERPRET
Integrate petrography with FTIR spectroscopy, XRD, core analysis and geological observations to investigate diagenesis and reservoir quality. Distinguish observed features from interpretations.
Method selection, sample suitability, reporting and interpretation are agreed in the scope; not every technique is required for every sample.
QEMSCAN · APPROVED EXAMPLE
This example follows a bulk cuttings sample into carbonate, mudstone and sandstone groups, with mineral maps and composition charts shown together. Explore the supplied animation to see how the presentation separates the groups.
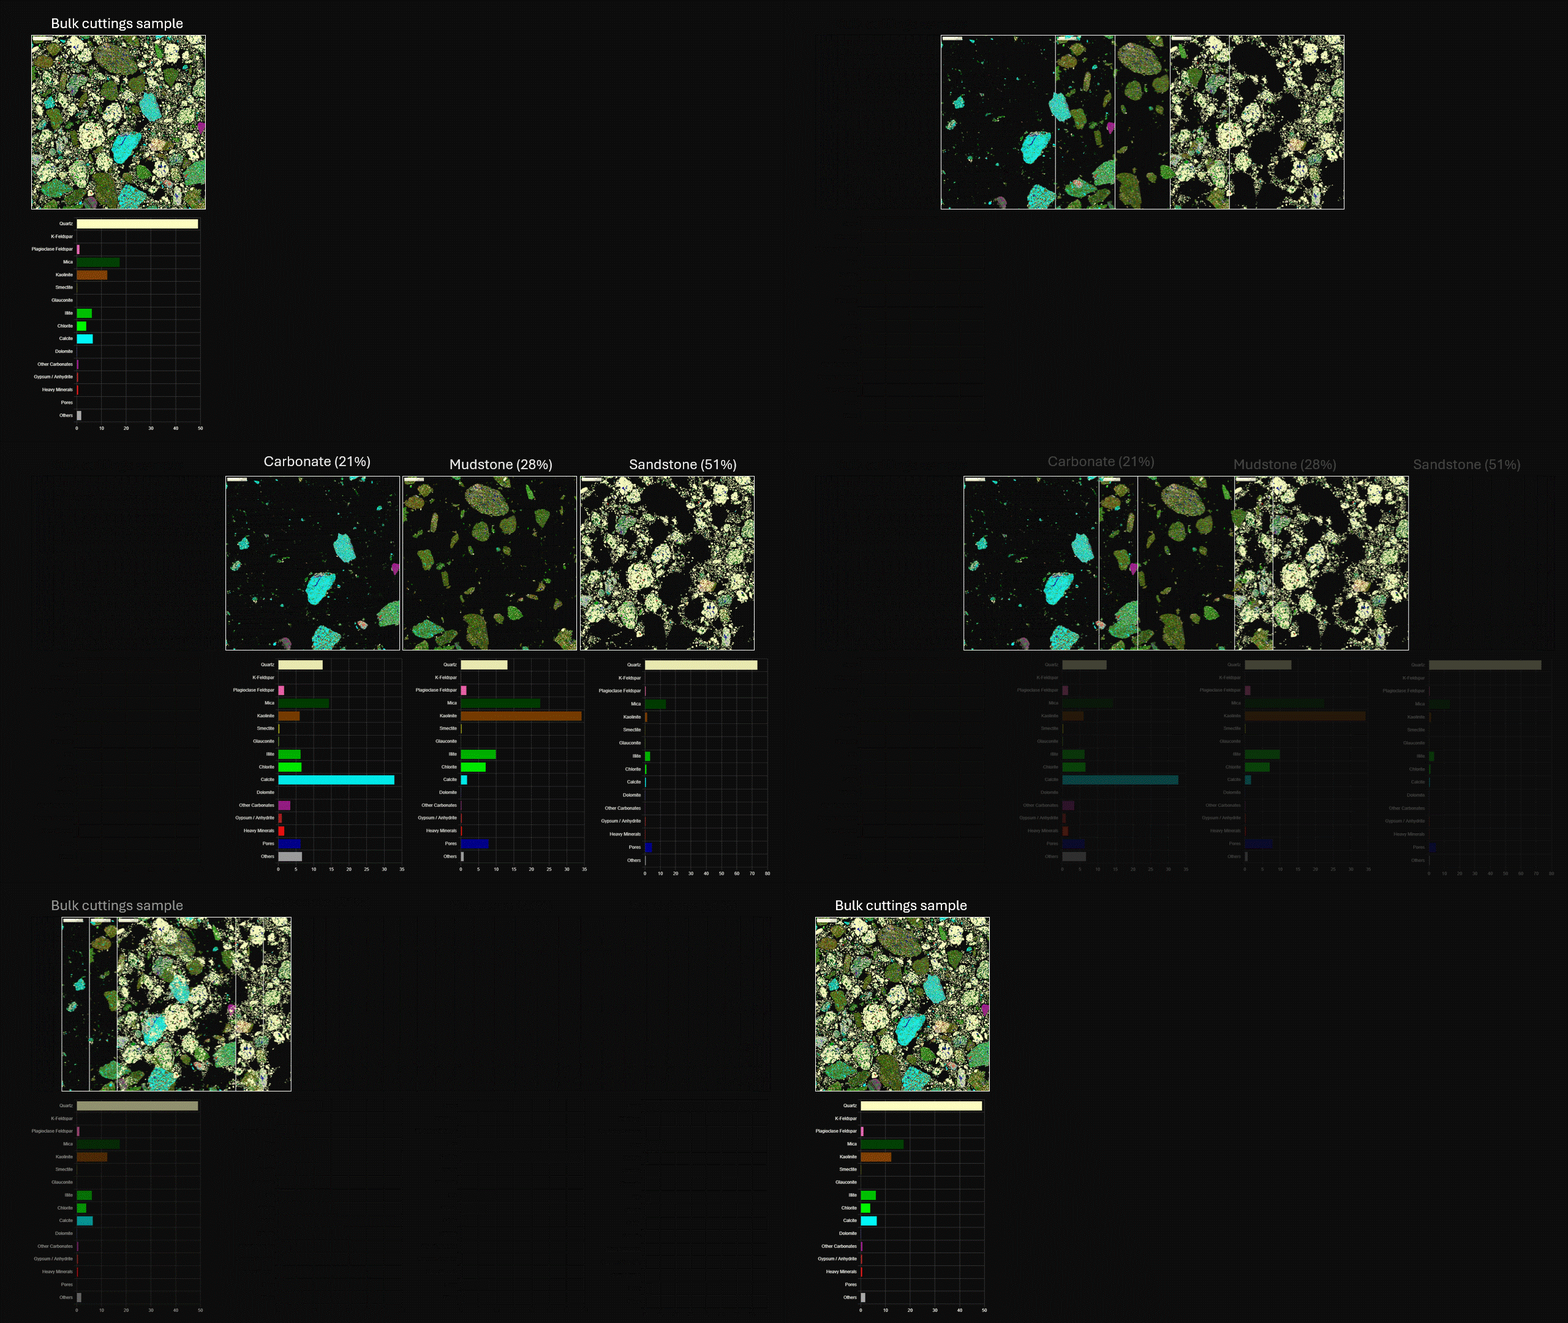
Read the mineral distribution alongside the accompanying chart, rather than treating a bulk composition as the complete description of a mixed sample.
Sample selection and analysis are tailored to your geological question. QEMSCAN deliverables and their integration with petrography, SEM and other core measurements are agreed for each programme.
IMAGE TO MINERAL MAP
Compare the supplied backscattered-electron image with its mineral overlay and classified mineral map.
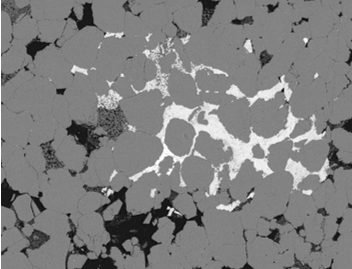
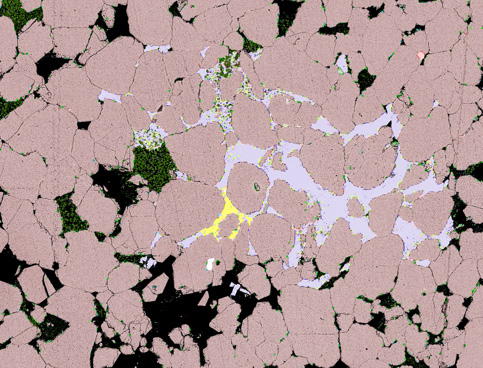
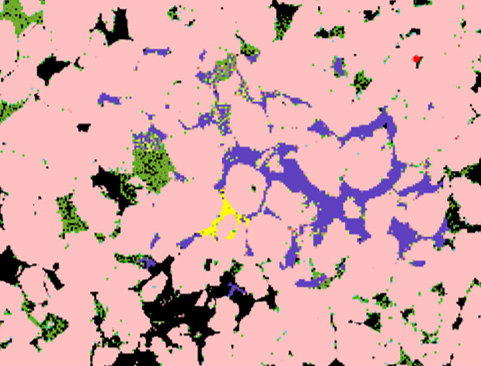
Original brochure classifications.
No scale bar supplied.
ILLUSTRATIVE DELIVERABLE FORMATS
These original schematic animations introduce different output formats.
ILLUSTRATIVE EXAMPLE
A conceptual pattern illustrates the presentation of diffraction peaks. No mineral identification or quantitative composition is implied.
ILLUSTRATIVE EXAMPLE
A conceptual spectrum illustrates absorption bands. It is not a mineral fingerprint, calibration or analytical result.
QUANTITATIVE PETROGRAPHY
Preparation can include cleaning, carbonate or clastic staining, and covered or uncovered sections. The preparation route is selected for the intended optical or electron-microscopy work.
Quantify grain components and visible macroporosity using a defined point-count protocol. Count totals and classification rules are agreed for the study and recorded with the results.
Quantify grain-size characteristics alongside grain framework, pore relationships and diagenetic observations. These section-based measurements complement particle-size analysis rather than replacing it.
Combine detailed descriptions, digital thin-section plates and quantitative tables with selected SEM and XRD results. Technical review and integration with measured porosity and permeability help explain reservoir quality.
Visible porosity in a thin section is not interchangeable with bulk laboratory porosity. Sampling, section orientation and the counting method influence the observations.
Explore routine core analysis ↗CTS is your point of contact for planning the programme and bringing the results together. Where specialist laboratory or interpretation input is required, delivery responsibilities are identified in your proposal.
The scope distinguishes the measurement package and its included outputs from additional processing, interpretation and interactive reporting. Sample requirements and method limitations are confirmed before work begins.
A CONNECTED WORKFLOW
Interpretation boundary
Individual samples and small fields of view may not represent the full interval. Selection and links to larger-scale observations are essential.