Curves you can interpret
Review preparation, curve quality and closure effects before deriving pore-throat distributions. Flag anomalous samples and assess whether the dataset represents the range of rock present.
 SUBSURFACE ANALYSIS
CHARACTERISE / SERVICE 03
Mercury injection capillary pressure analysis connects pore-throat measurements with hydraulic rock typing, SCAL sample selection and reservoir calibration.
THE QUESTION
Similar porosity can conceal different pore-throat systems. Combine HPMI/MICP with routine core analysis, geology and SCAL to investigate those differences, test sample representativeness and establish which reservoir applications the evidence supports.
MEAN HYDRAULIC RADIUS
The example follows capillary-pressure behaviour through hydraulic-radius distributions to a Mean Hydraulic Radius (MHR) interpretation. Comparing pore-volume and permeability contributions helps explain why different pore systems can have different flow behaviour.
Example conditions: the source relates a maximum reservoir capillary pressure of 500 psi to a hydraulic radius of 0.2 µm for its water-saturation interpretation. These values are specific to this example and its conversion assumptions.
Source: Virtual Petrophysics; Ed Clerke, SPE Dubai 2012.
PORE-SYSTEM CHARACTERISATION
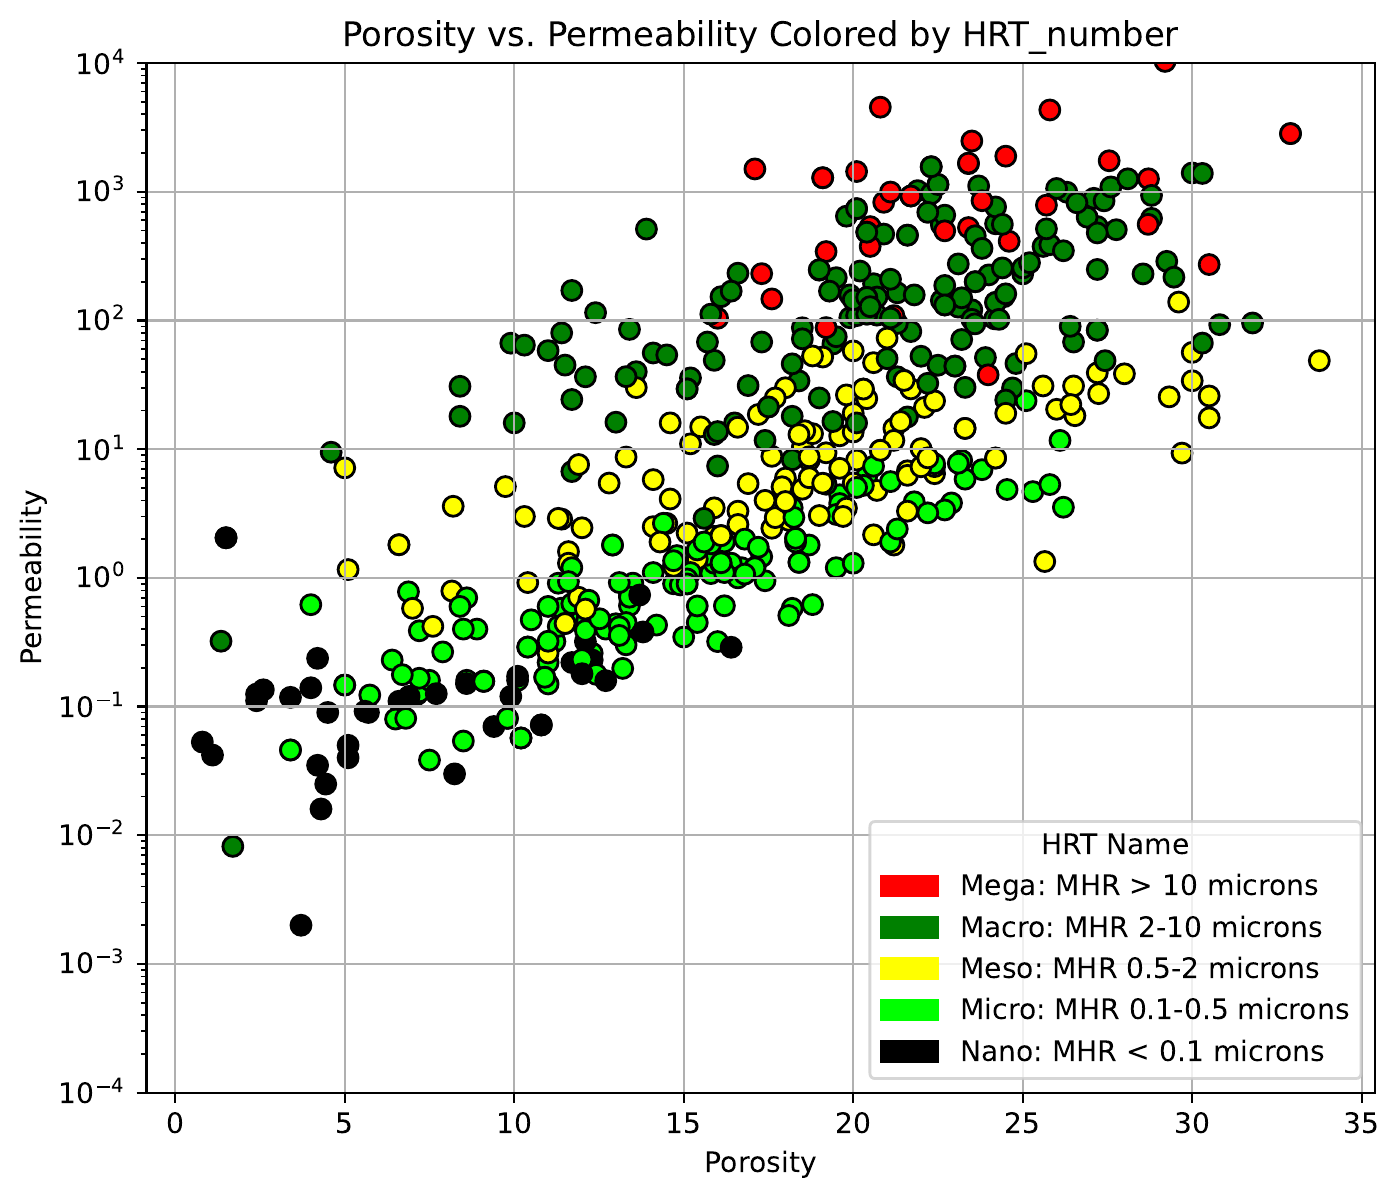
Hydraulic rock typing adds pore-system context to a porosity–permeability crossplot. Review the spread within each class, identify outliers and assess whether the selected samples cover the wider rock population.
Use this view alongside geology and laboratory QC to identify gaps before further SCAL testing or reservoir calibration.
Select any plot to inspect it at full size.
PERMEABILITY ASSESSMENT
Review MICP-derived permeability estimates against core permeability across hydraulic rock types. Differences between methods and individual samples guide QC and reservoir-specific calibration.
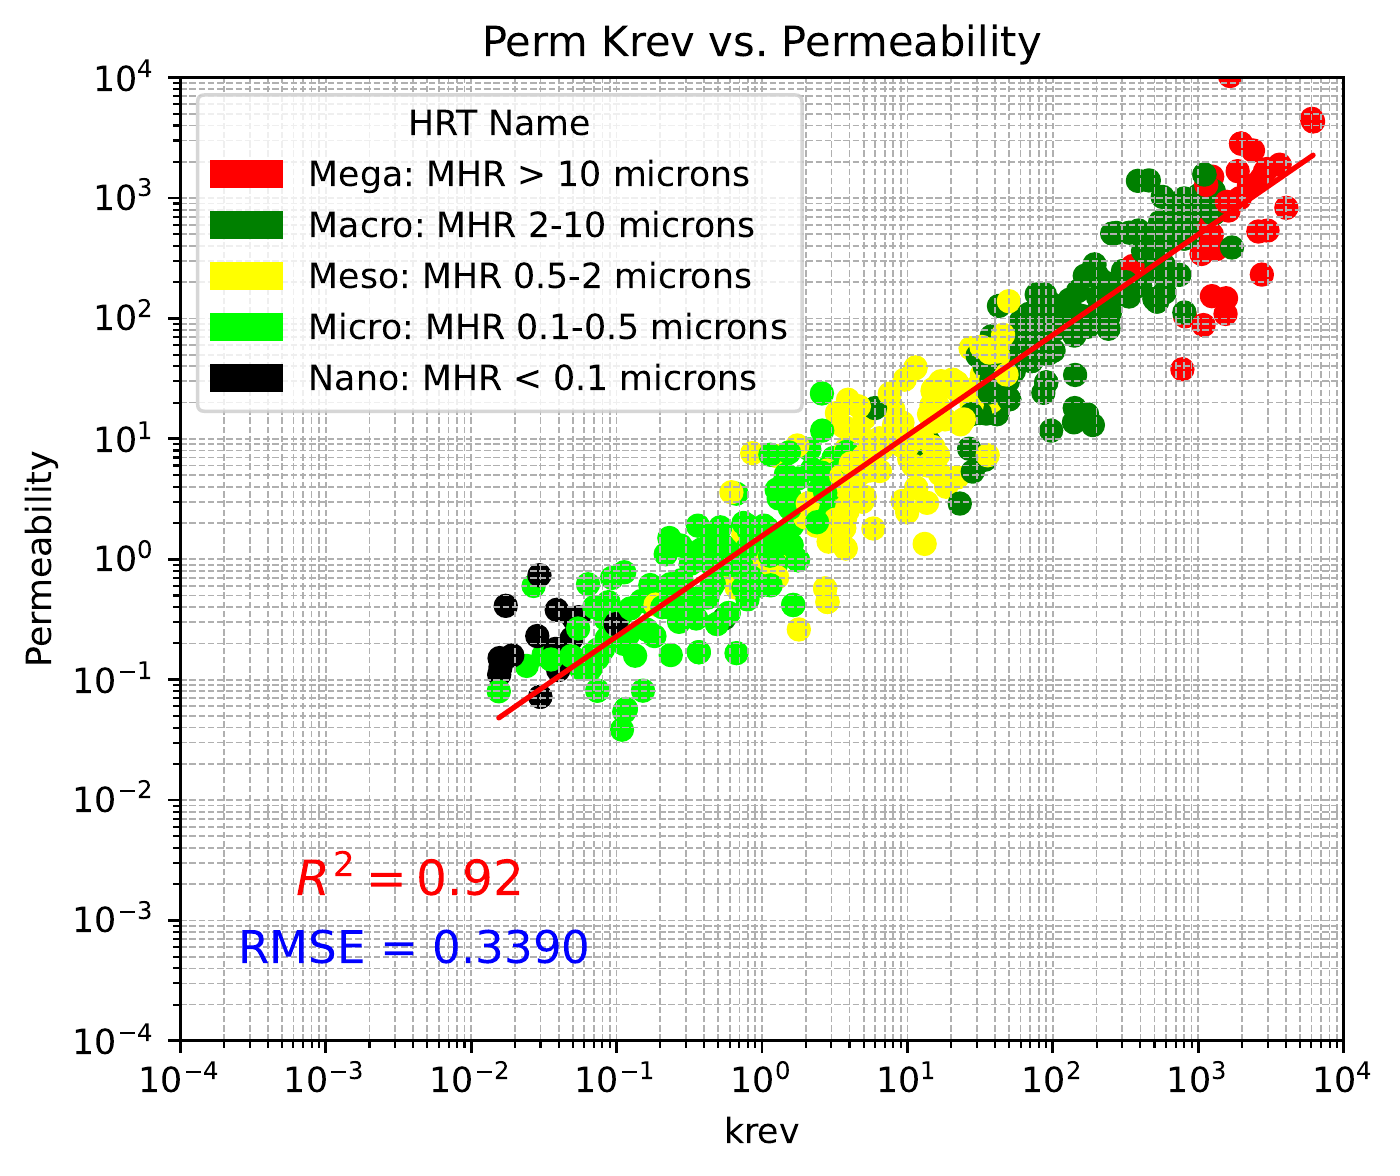
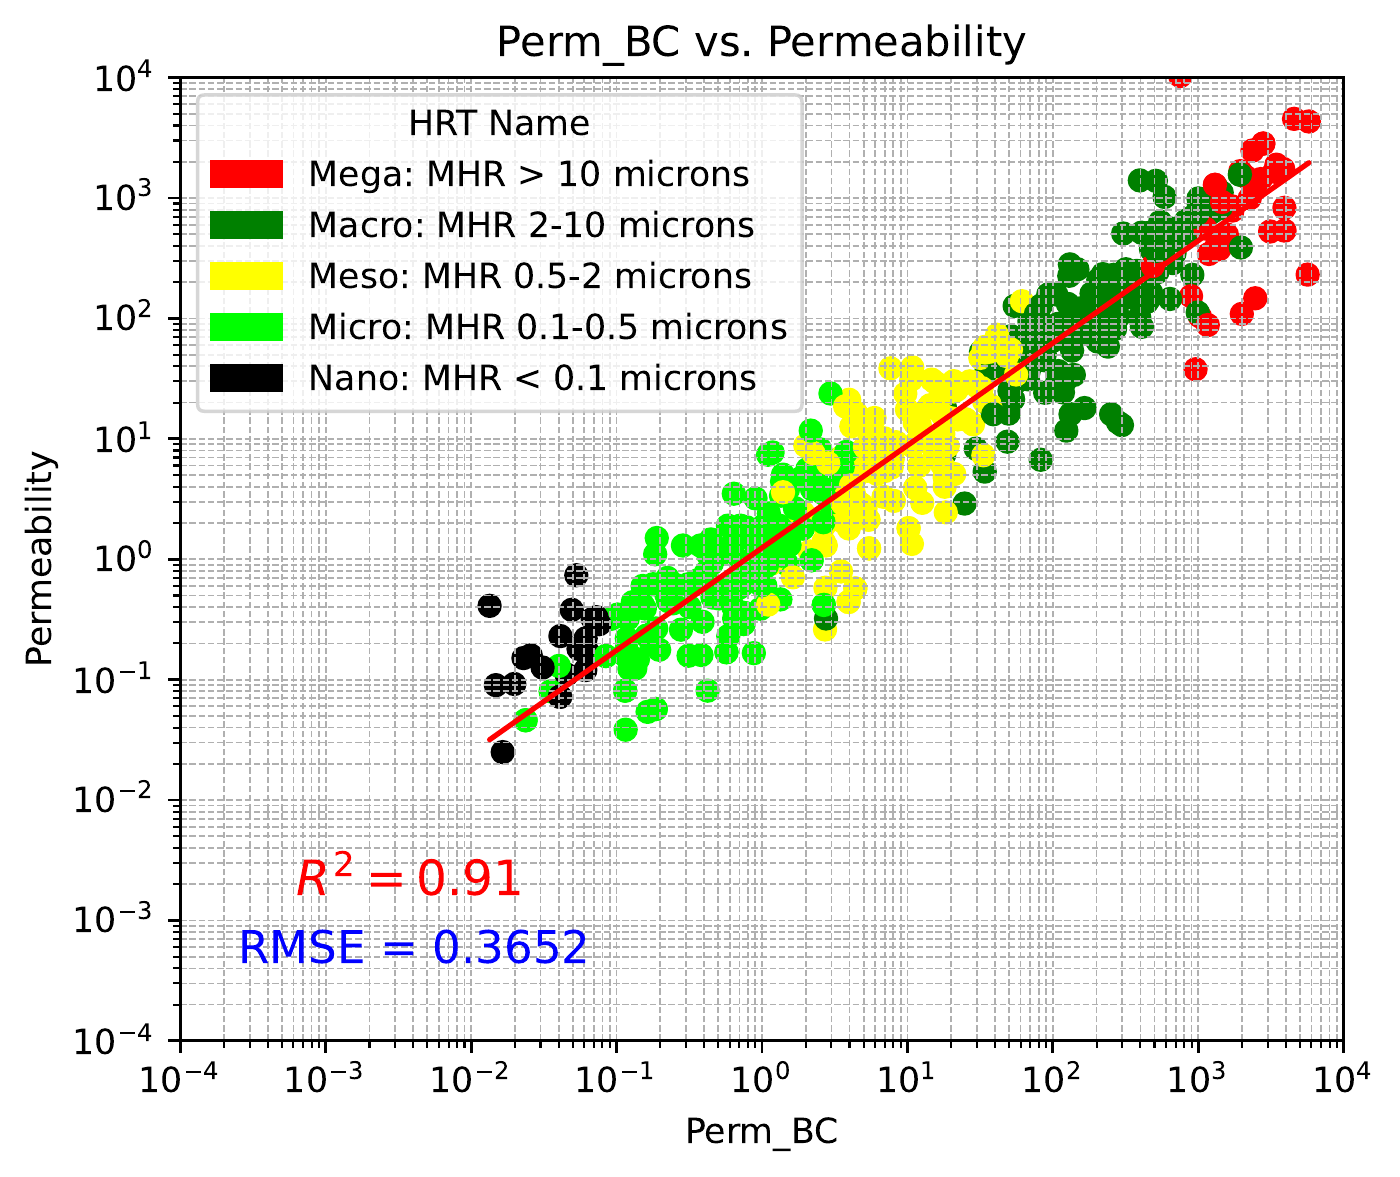
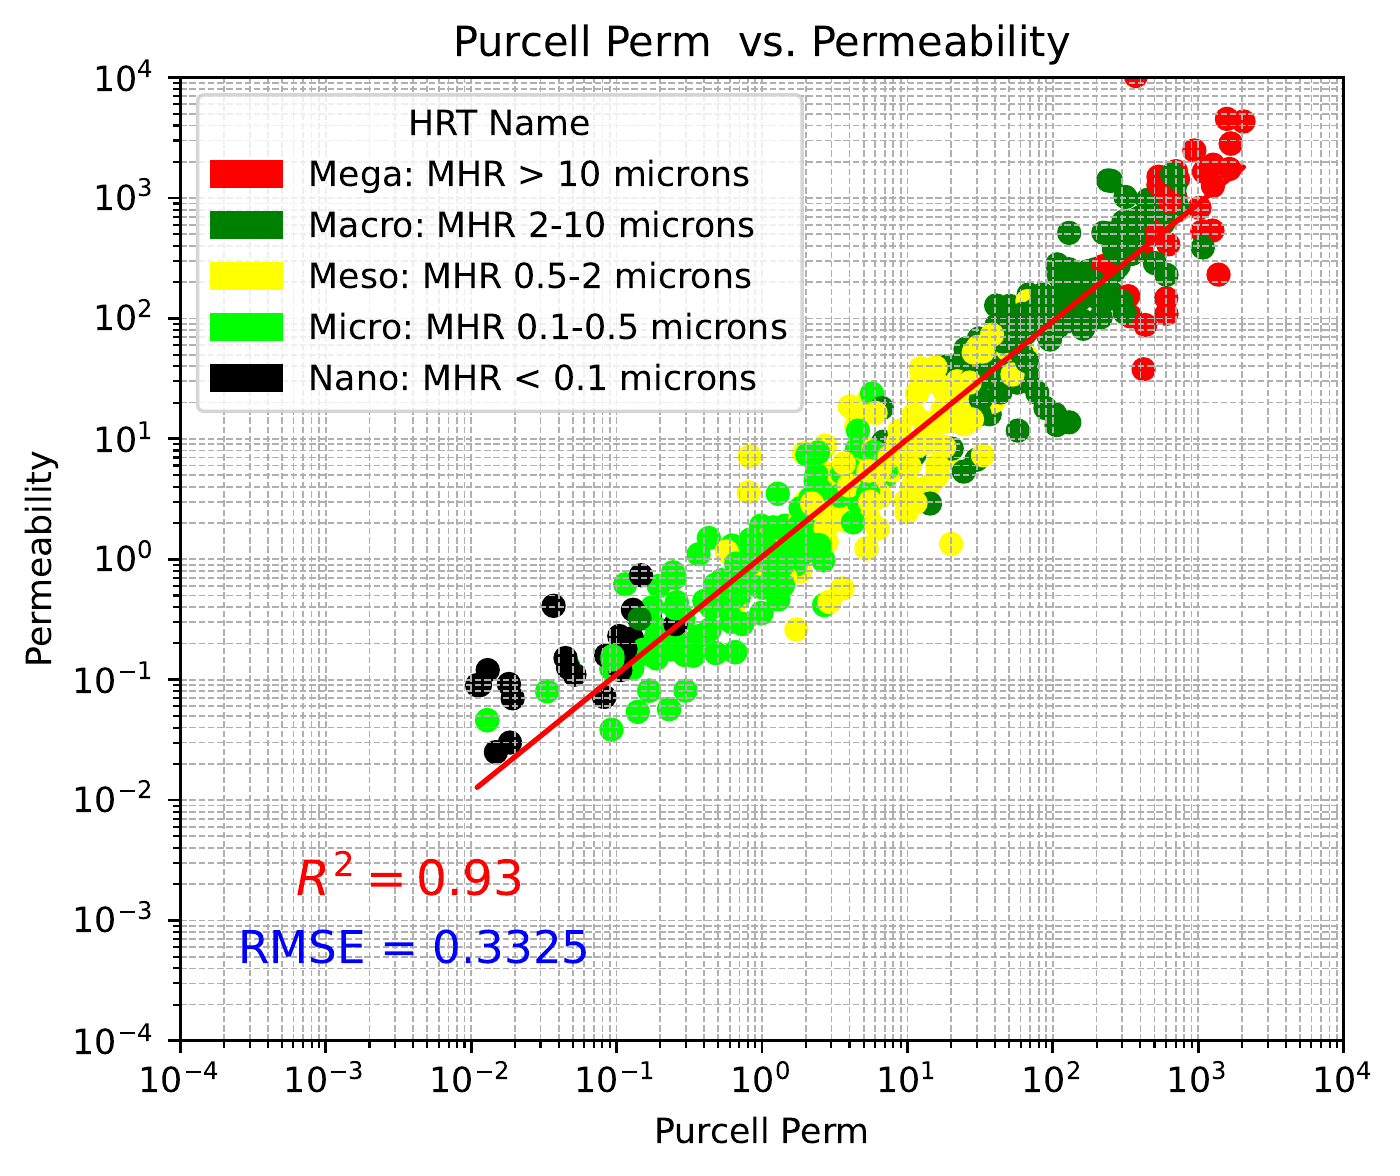
Example comparison plots. Fit statistics describe this dataset, not guaranteed predictive performance in other reservoirs.
PORE SYSTEMS & RESERVOIR APPLICATIONS
Connect laboratory measurements with sample selection, permeability assessment and reservoir-specific saturation modelling. Start with new measurements or bring an existing HPMI/MICP dataset for review.
HPMI/MICP records mercury intrusion against pressure. Pore-throat distributions and subsequent interpretations are derived using documented assumptions and quality checks. Measurement and QC, pore-system interpretation and calibrated reservoir applications are distinct parts of the scope—not automatic inclusions in every measurement commission.
Review preparation, curve quality and closure effects before deriving pore-throat distributions. Flag anomalous samples and assess whether the dataset represents the range of rock present.
Use Mean Hydraulic Radius (MHR), hydraulic rock typing (HRT) and MICP-derived permeability estimates (KREV) to investigate pore-system differences. Compare derived permeability with measured routine core analysis.
Assess proposed plugs and trims against the hydraulic rock-type population. Identify missing classes and target additional samples before committing to a larger SCAL programme.
Where the supporting evidence allows, develop GEV/Gaussian capillary-pressure parameters and saturation-height relationships. Extend calibrated results to well logs and reservoir models with documented uncertainty and quality checks.
CORE-TO-LOG INTERPRETATION
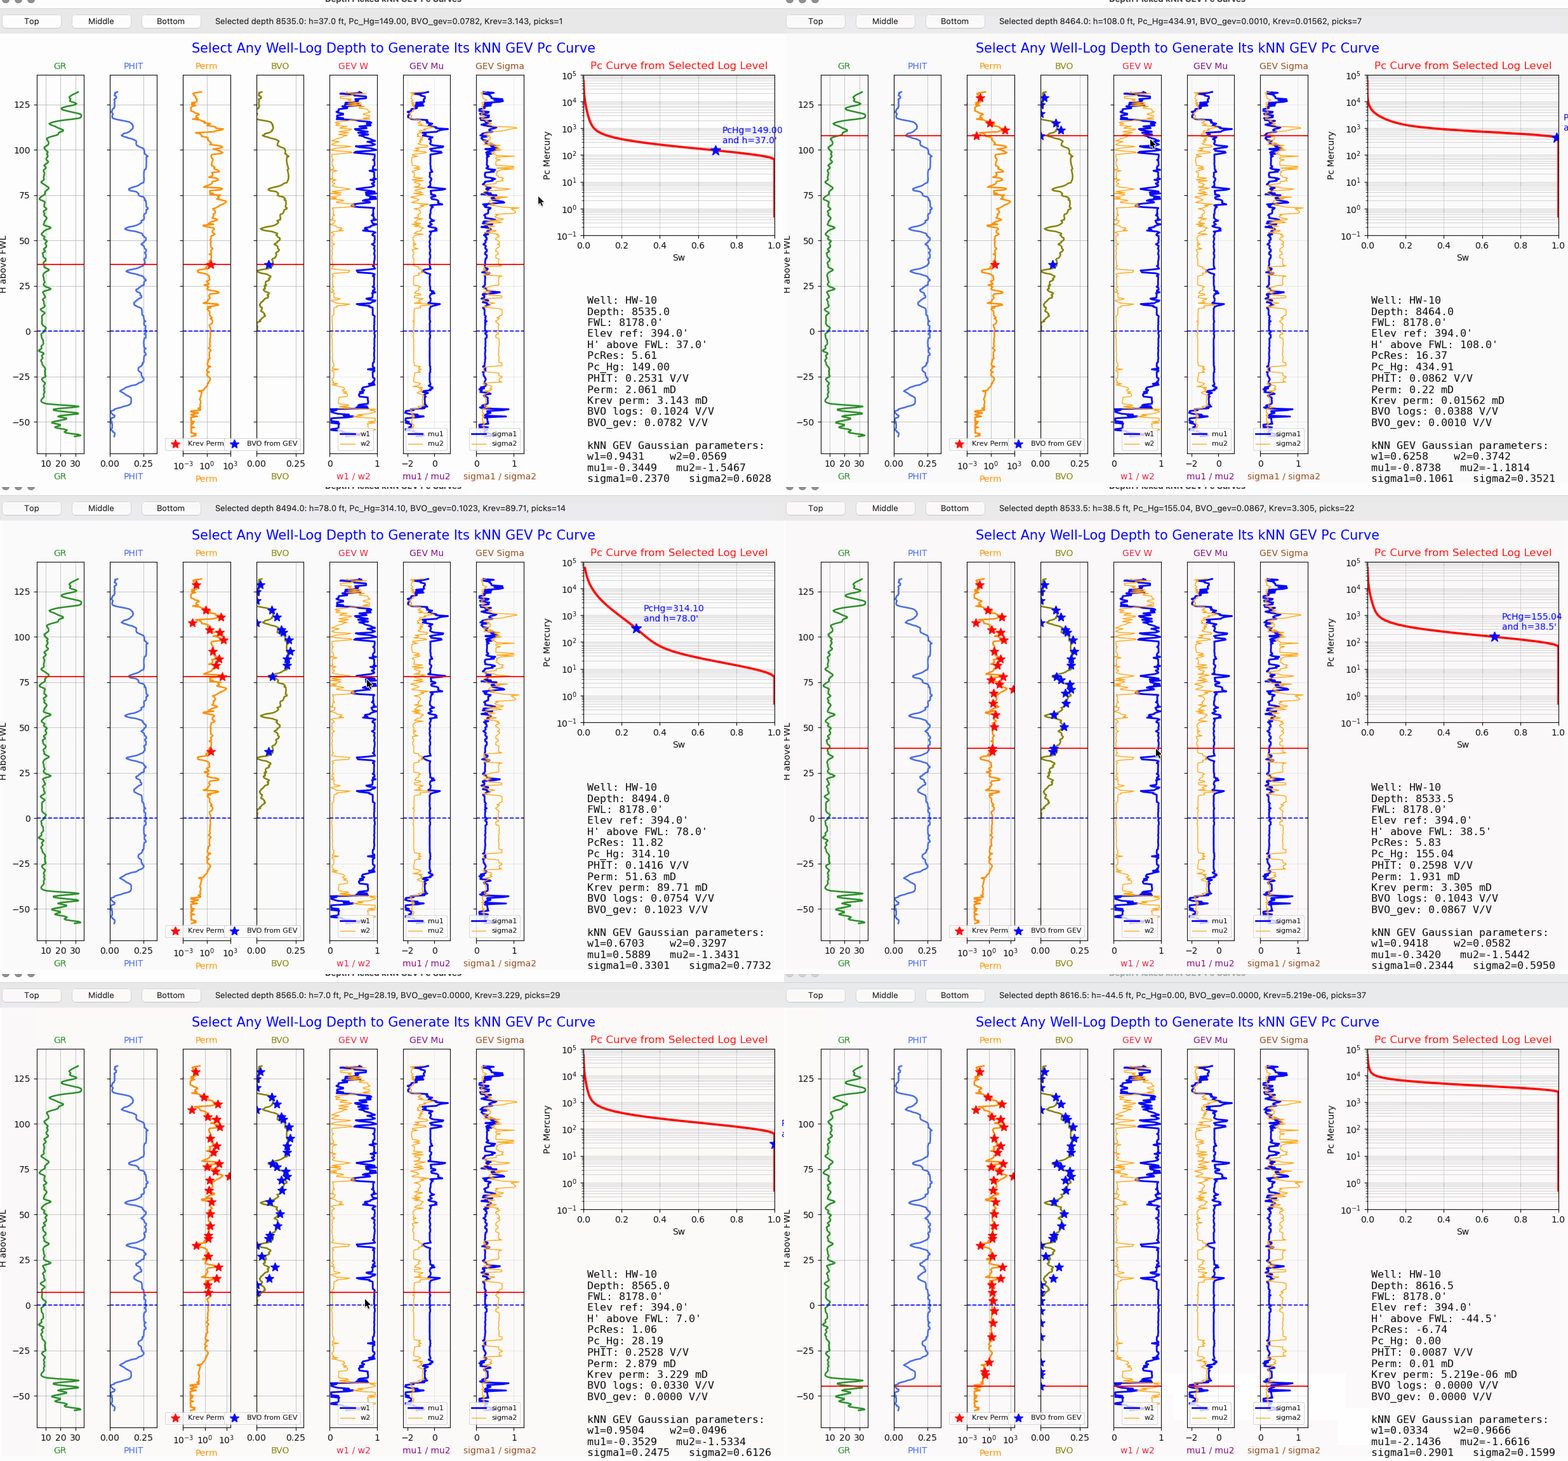
Follow the selected position across the log tracks as the corresponding modelled capillary-pressure curve updates. This animated walkthrough shows how pore-system interpretation can support water-saturation and bulk volume oil (BVO) assessment.
Quality-check MICP curves and assess pore-system coverage against routine core analysis and the geological context.
Fit capillary-pressure behaviour and establish reservoir-specific relationships before extending parameters to log positions.
Examine the selected curve alongside height above the free-water level, porosity and permeability. Assess saturation and BVO consistency using the agreed fluid and contact assumptions.
Deliver calibrated saturation-height relationships and model inputs with uncertainty flags and checks against independent evidence.
CAPROCK & CO₂ STORAGE
Link quality-reviewed MICP curves with baseline rock properties and mineralogy. Record the entry-pressure criterion and distinguish mercury measurements from fluid-system conversions and any separately commissioned direct CO₂ testing.
Explore caprock characterisation for CCUS ↗FIXED-SCOPE INITIAL SCREEN
A focused review of existing MICP, routine core analysis, SCAL and log data establishes quality, sample coverage and calibration potential. Receive a data-gap assessment, technical review and a recommended next-phase scope.
ProceedThe evidence supports the proposed next phase.
Add targeted dataClose specific measurement or sample-coverage gaps.
Pause or reviseAdjust the scope where the evidence is insufficient.
Discuss your MICP dataset ↗COMPLEMENTARY PORE-SYSTEM MEASUREMENTS
Measure specific surface area using nitrogen adsorption and an agreed BET evaluation. This provides complementary evidence for fine-grained rocks alongside MICP, mineralogy and microscopy.
Agree cleaning, drying and degassing around sample sensitivity. Report the preparation conditions and evaluation basis so results can be compared meaningfully.
Review the condition and preparation history of archived plugs. Scope trimming, re-cleaning or re-drying where needed before starting a new MICP programme.
Combine accessible surface-area measurements with pore-throat distributions and mineral textures. Use the evidence to guide representative sample selection and reactive-model inputs.
BET surface area is not a direct measure of CO₂ storage capacity or capillary seal strength. MICP and adsorption probe different aspects of the accessible pore system.
Connect pore-system evidence with CCUS ↗CTS is your point of contact for planning the programme and bringing the results together. Where specialist laboratory or interpretation input is required, delivery responsibilities are identified in your proposal.
The scope distinguishes the measurement package and its included outputs from additional processing, interpretation and interactive reporting. Sample requirements and method limitations are confirmed before work begins.
A CONNECTED WORKFLOW
Interpretation boundary
MICP is destructive. Derived permeability does not replace measured core permeability. Reservoir-fluid conversion, saturation-height and model extension require reservoir-specific assumptions and calibration. Relative-permeability work requires supporting SCAL and wettability evidence; MICP alone is not a universal predictor.