CORE SCIENCE. CONNECTED.
Core analysis
and imaging.
See deeper.
CT imaging, CoreDNA logging, HPMI/MICP and specialist analysis—connected through a question-led programme from our Aberdeen base.
Discuss your project ↗Explore our services ↗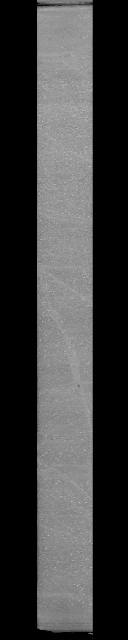
COREDNA / ACQUISITION CONCEPT
Illustrative tracks · not measurements from this core
Real CT data. Explore structure, attenuation contrast and a connected acquisition concept.
About the visualisation
Real CT imagery from a 472 × 472 × 3,222 grid. Desktop uses a core-centred 240 × 240 crop sampled to 192 × 192 × 1,280; mobile uses a 128 × 128 × 640 preview. Recorded reconstruction voxel size: 0.2917 mm; slice interval: approximately 0.292 mm. These are sampling intervals, not resolving power. Display position is relative; this view does not provide a verified physical-length measurement. Colour and transparency emphasise attenuation contrast—not identified minerals or calibrated density. CoreDNA tracks and the prepared-surface scanning effect are illustrative, not live acquisition or aligned measurements from this specimen.
A CONNECTED PERSPECTIVE
Detail matters.
So does the bigger picture.
From our Aberdeen base, we help teams acquire the right observations, select meaningful samples and integrate specialist evidence into their wider core-analysis programme.
OUR CAPABILITIES
The right methods.
A clearer understanding.
Core imaging · Laboratory analysis · Integrated interpretation
Explore the techniques and outputs available for your core-analysis programme.
Explore our servicesFROM ACQUISITION TO INTERPRETATION
A question-led workflow.
Define the decision first.
Build the programme around it.
Define
Agree the geological question, available material and required scale.
Acquire
Plan the imaging and analytical observations needed to investigate it.
Connect
Bring the observations together and assess their geological context.
Interpret
Explain the findings, limitations and implications for the next decision.
INTERACTIVE REPORTING & VISUALISATION
Keep the evidence
within reach.
Connect the image, the measurement and the interpretation. Scope a delivery that helps your team explore results and understand their context.
Explore connected reporting ↗CONNECTED REPORTING / CONCEPT
Core imagery & sample context
Aligned measurements & analytical results
Quality checks, coverage & uncertainty
Findings & the evidence behind them
START WITH YOUR QUESTION