Measure the size distribution.
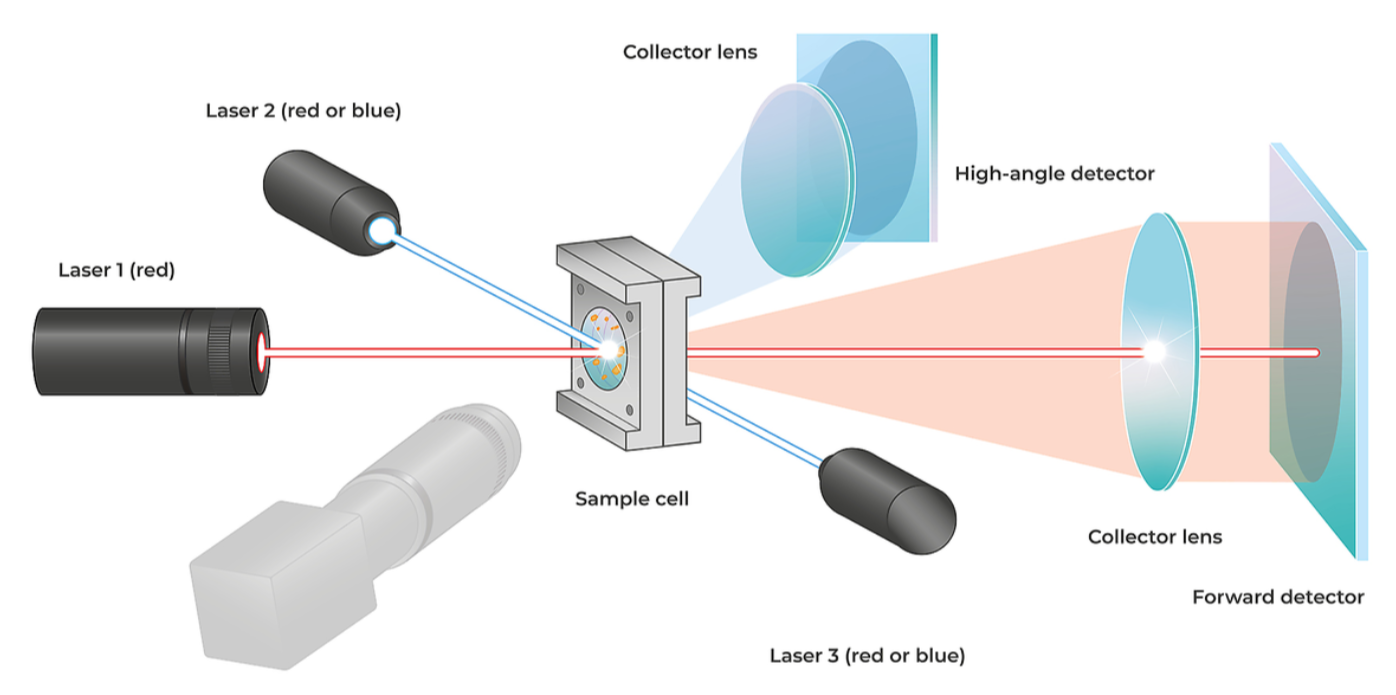
Laser light interacts with dispersed particles in the sample cell. The detected scattering pattern supports calculation of a particle-size distribution using the selected analysis settings.
 SUBSURFACE ANALYSIS
CHARACTERISE / SERVICE 06
Particle characterisation combines laser diffraction and dynamic image analysis to investigate particle-size distributions and shape.
THE QUESTION
A single average cannot describe every feature of a distribution. Review the measured spread, percentiles and repeatability alongside the preparation method to understand the material tested.
HOW IT WORKS
Laser light interacts with dispersed particles in the sample cell. The detected scattering pattern supports calculation of a particle-size distribution using the selected analysis settings.
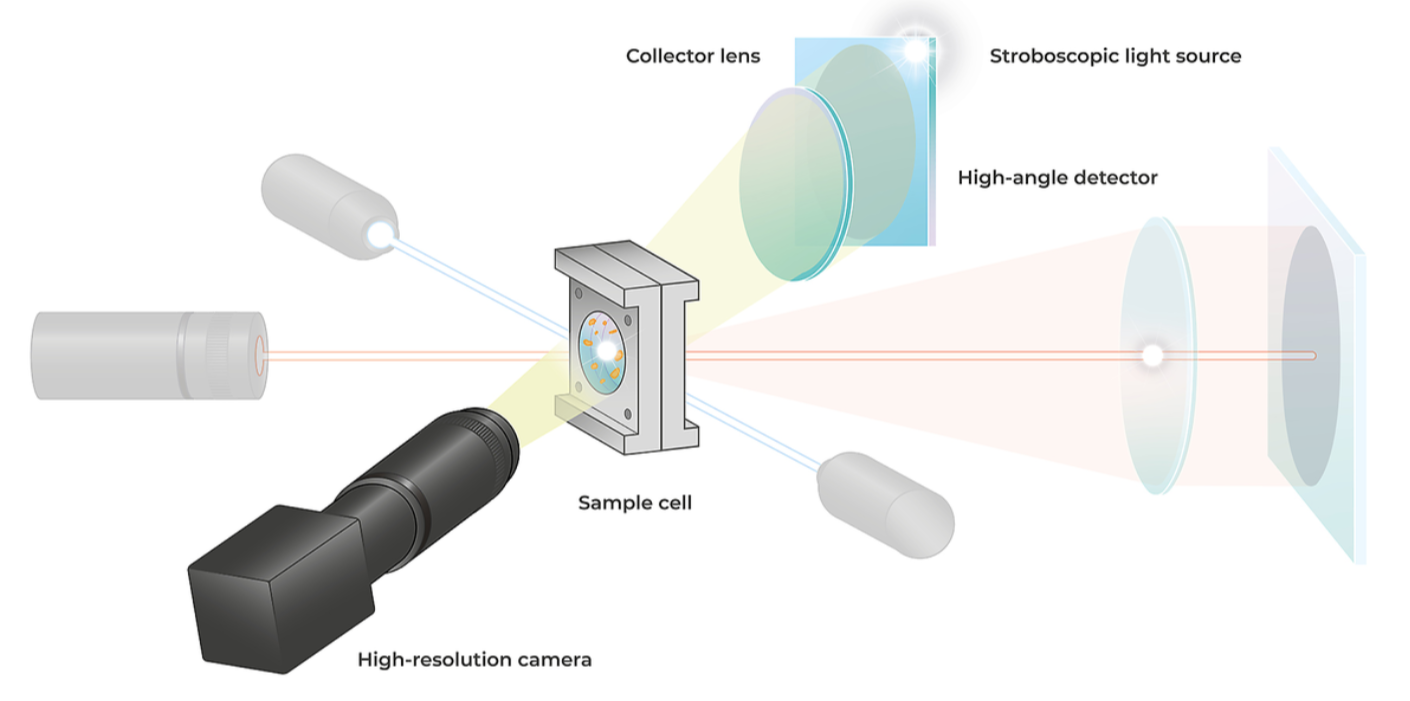
A stroboscopic light source and camera capture individual particles as they pass through the cell. Image analysis adds shape measurements and particle imagery alongside the size distribution.
PARTICLE CHARACTERISATION · EXAMPLE OUTPUTS
Size plots show the supplied three-measurement average; shape statistics describe the supplied first imaging run.
Volume fractions per exported size bin—not a probability density. Source bin widths are unequal.
D10: 63.69 µm · D50: 198.72 µm · D90: 308.88 µm
Volume-based percentiles from the supplied summary.
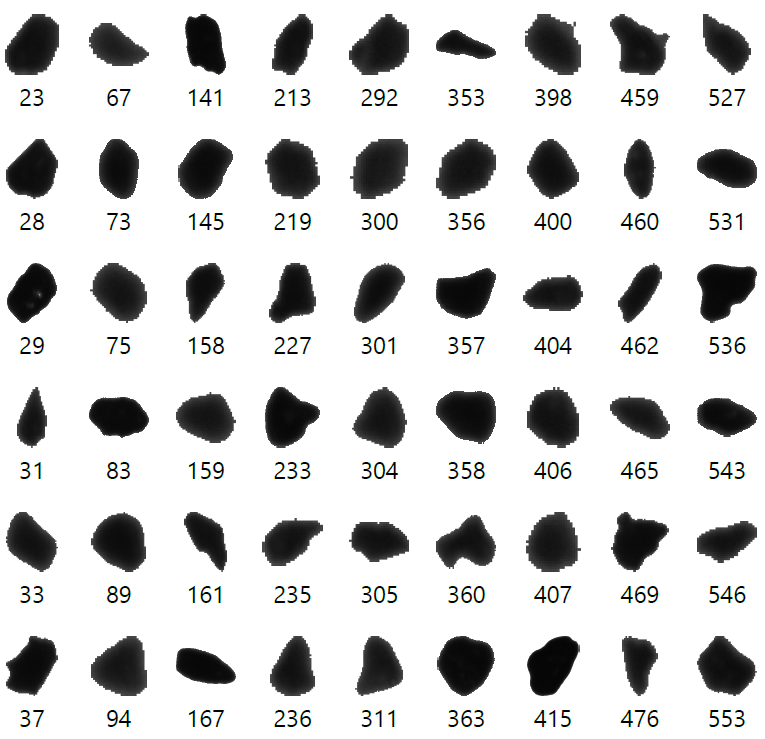
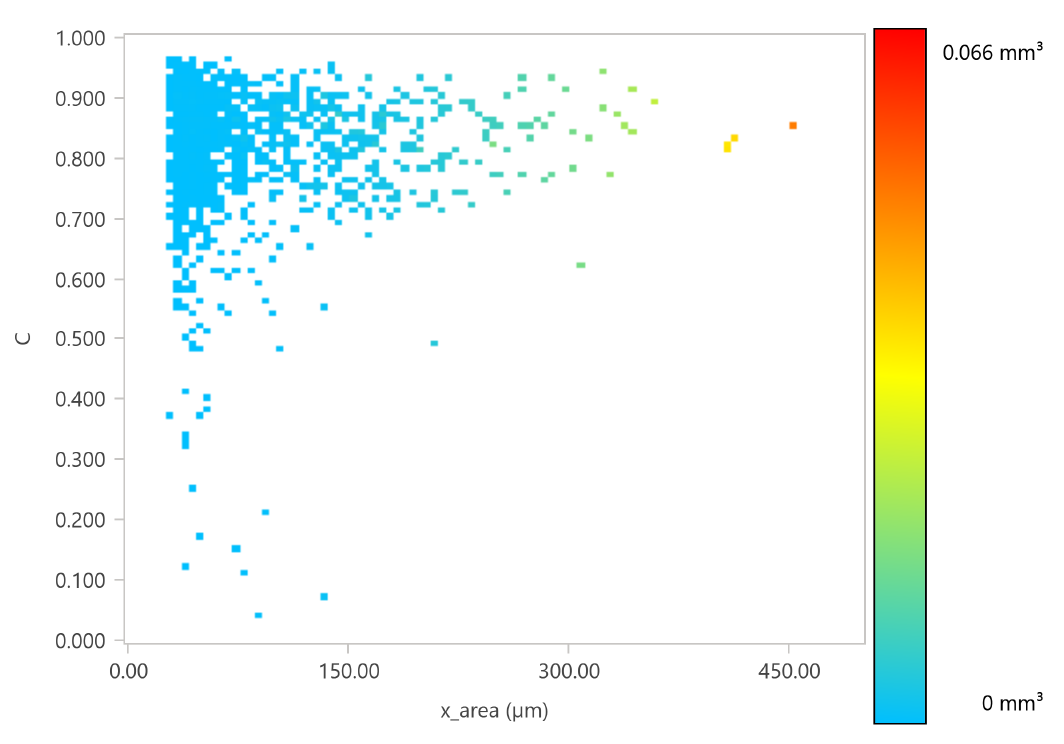
7,196 particles · count-weighted, not volume-weighted. Ten equal-width ratio bins; not a mineral classification.
DYNAMIC IMAGE ANALYSIS
CTS is your point of contact for planning the programme and bringing the results together. Where specialist laboratory or interpretation input is required, delivery responsibilities are identified in your proposal.
The scope distinguishes the measurement package and its included outputs from additional processing, interpretation and interactive reporting. Sample requirements and method limitations are confirmed before work begins.
A CONNECTED WORKFLOW
Interpretation boundary
Results describe the prepared particles under the stated measurement conditions. Dispersion and aggregation can affect the result. These measurements are distinct from CoreDNA image-derived grain-size estimates and do not measure pore-throat size.