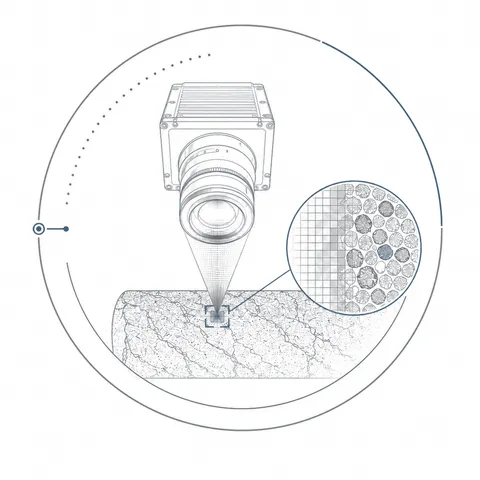
01Core photography
Panoramic and ultra-high-resolution imagery records the prepared surface. White-light and UV options support review of texture and fluorescence.
 SUBSURFACE ANALYSIS
ACQUIRE / SERVICE 02
Multi-sensor core logging connects imagery, elemental composition and physical measurements to guide targeted sampling and subsequent analysis.
COREDNA / ACQUISITION CONCEPT
Illustrative tracks · not measurements from this core
Diamond-tipped scraping prepares a 4 cm-wide strip before sensor passes. CT-based workflow illustration; groove depth and tool geometry are schematic, not a measured surface profile or live acquisition.
Real CT data. Explore structure, attenuation contrast and a connected acquisition concept.
Real CT imagery from a 472 × 472 × 3,222 grid. Desktop uses a core-centred 240 × 240 crop sampled to 192 × 192 × 1,280; mobile uses a 128 × 128 × 640 preview. Recorded reconstruction voxel size: 0.2917 mm; slice interval: approximately 0.292 mm. These are sampling intervals, not resolving power. Display position is relative; this view does not provide a verified physical-length measurement. Colour and transparency emphasise attenuation contrast—not identified minerals or calibrated density. CoreDNA tracks and the prepared-surface scanning effect are illustrative, not live acquisition or aligned measurements from this specimen.
THE QUESTION
Isolated measurements can miss important variations along the core. CoreDNA helps identify changes in rock character before choosing plugs for routine analysis, SCAL, mineralogy or geomechanics. Fresh and archive cores can be assessed. Available sensor options include FTIR spectroscopy and magnetic susceptibility, with the package matched to the geological question and condition of the material.
SELECT THE MEASUREMENTS THAT MATTER
Choose a sensor package for the geological question. Measurements share a depth reference so specialists can compare evidence across disciplines. Acquisition spacing and coverage depend on the selected methods and sample condition.
Panoramic and ultra-high-resolution imagery records the prepared surface. White-light and UV options support review of texture and fluorescence.
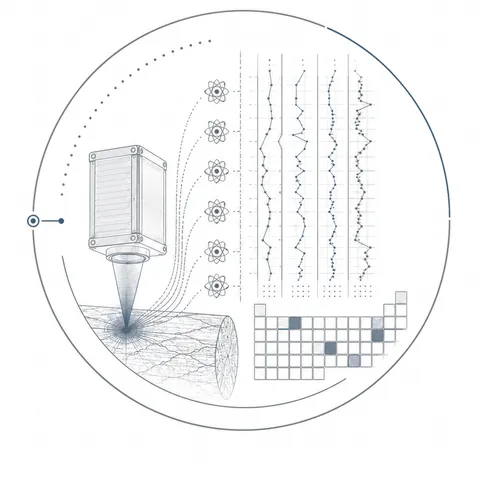
Depth-referenced elemental profiles support investigation of compositional variation. Mineralogical estimates require interpretation and suitable reference measurements.
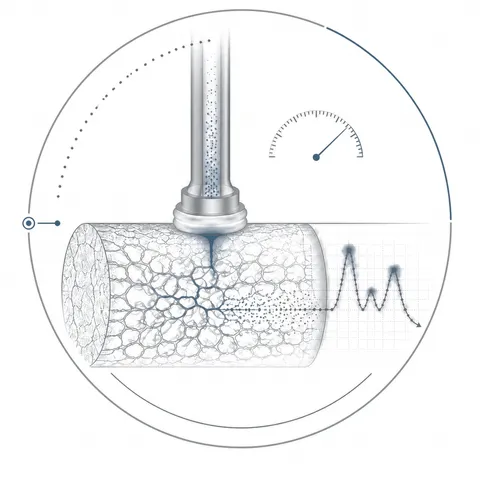
Gas-permeability profiles help investigate variation along the prepared surface. Test conditions, surface quality and comparison with plug measurements form part of the agreed quality checks.
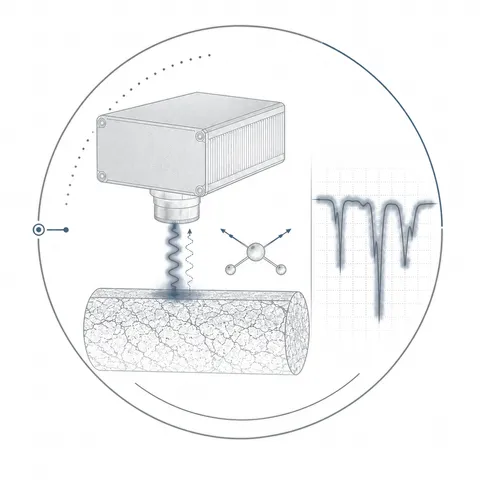
Infrared spectra provide evidence for mineralogical investigation alongside elemental measurements and reference analyses.
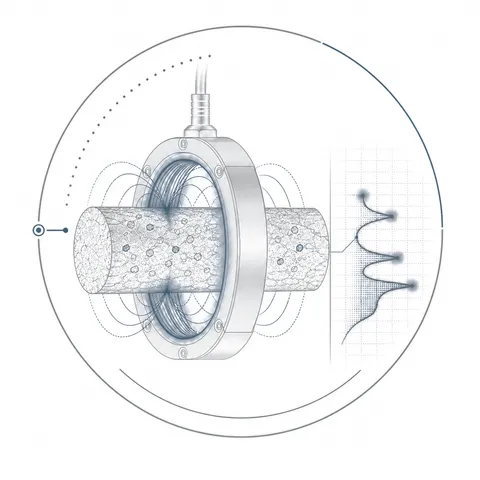
A depth-referenced magnetic-response log complements imaging and geochemistry when investigating changes in rock character.
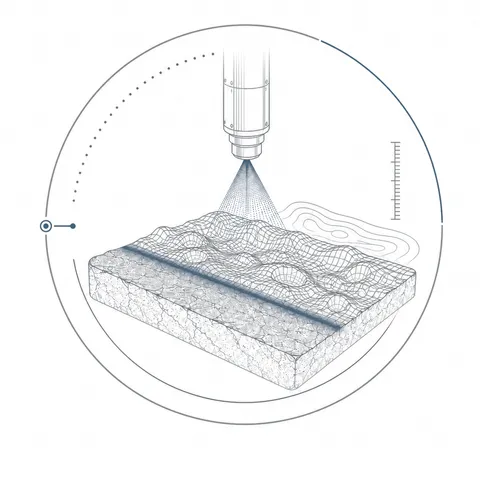
Surface topography supports derived grain-size estimates. Grain-size outputs depend on the rock texture, preparation and suitability of the method.
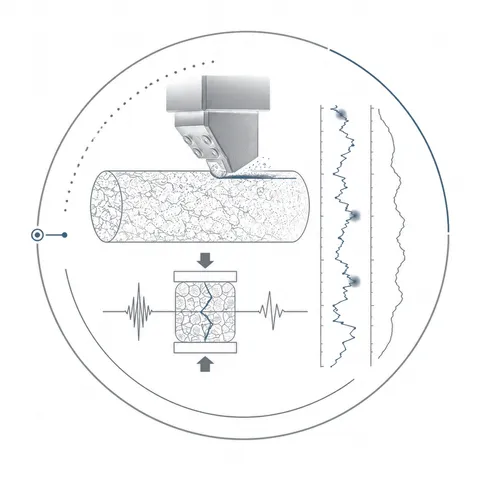
Controlled scratches provide a rock-strength profile for assessing mechanical variation and targeting follow-up laboratory tests.
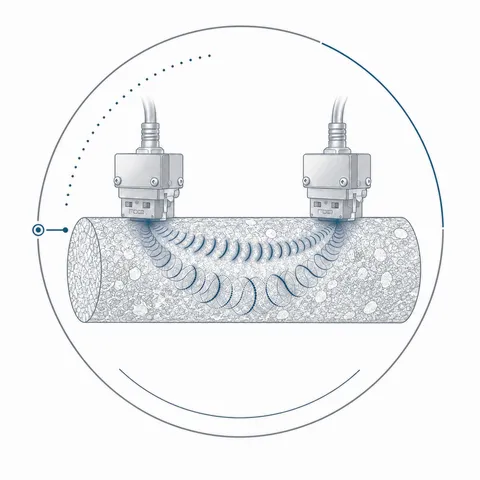
P- and S-wave measurements support acoustic-property profiles and derived dynamic properties where sample condition and contact are suitable.
FROM CONTINUOUS LOGS TO TARGETED TESTS
Connect imaging and sensor profiles, identify changes in rock character, and target representative samples for laboratory testing. Use the results to refine the interpretation along the core.
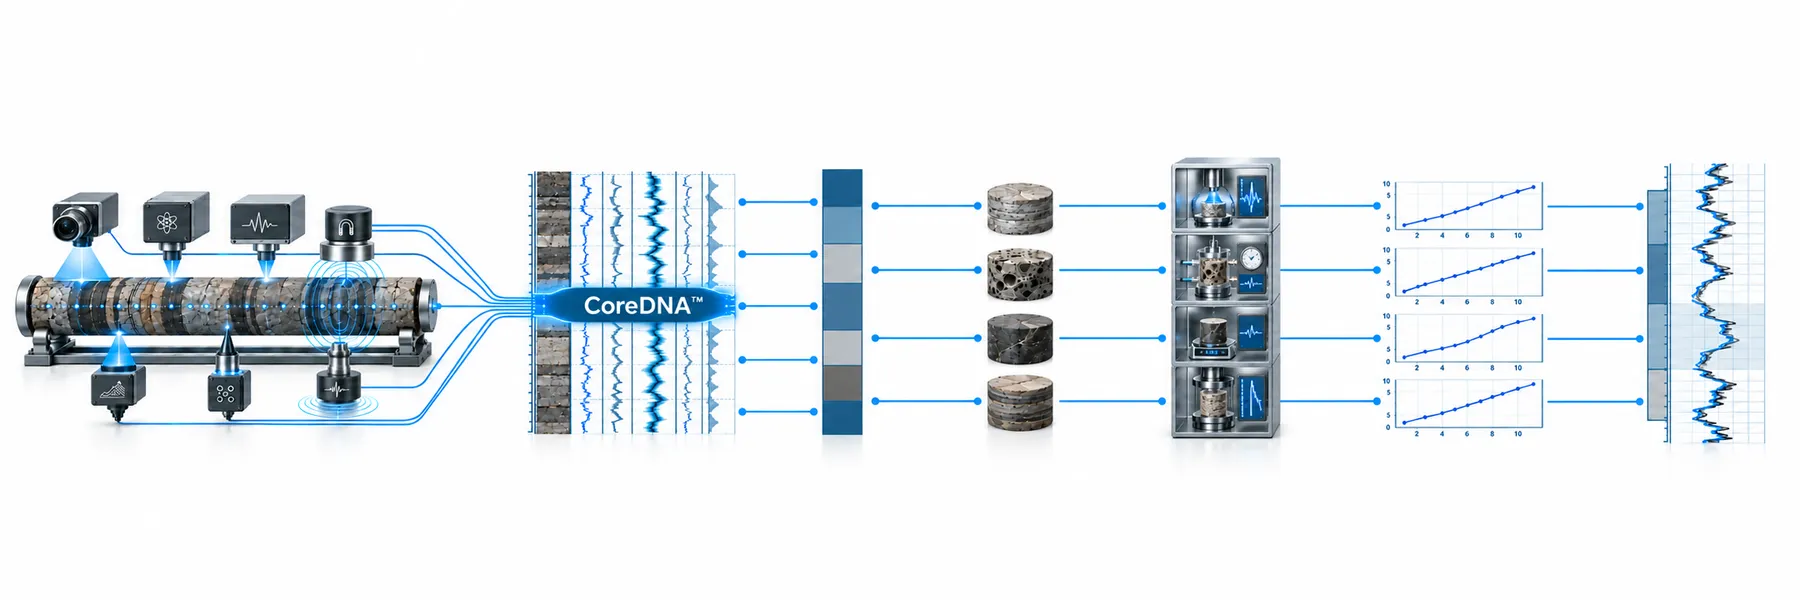
CoreDNA illustrations: EPSLOG.
MiniSlab preparation creates a narrow, fresh, flat surface for imaging and sensor contact. It removes material, so the preparation plan is agreed before work begins. The approach supports fresh whole core and suitable archive, slabbed or split material, with sample suitability assessed for each programme.
HR OVERVIEW / LINKED UHR DETAIL / REAL DATA
The supplied strength track is reported in MPa. Its calibration and the exact strength property are not specified in this demonstration export; do not treat it as a direct unconfined compressive-strength test. Grain-size indices and cluster classifications are derived interpretations.
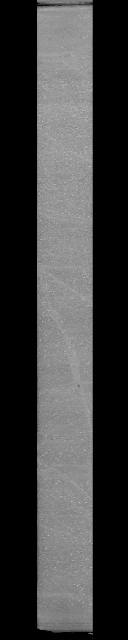
Approved HR and UHR imagery with measurements and derived tracks from the same supplied interval. The vertical scale is distance from the start of this 96.8 cm excerpt, not well depth. Original depths and identifiers are omitted. Each track retains its own sampling positions and missing values. Alignment follows the supplied matched-image interval, not an independent pixel-level calibration.
Report-style grouping: grain-size percentiles share a scale; each XRF curve has its own labelled scale. Cluster IDs use discrete markers and a colour strip, not a continuous curve.
Move along the core with the slider or interval buttons. The image and tracks share the same visible interval. Scroll sideways for additional tracks; point at a track to inspect its readings. Curves retain source units; indices and cluster IDs are derived outputs, not direct mineral measurements.
Cluster key (categorical, not ranked): ID 0ID 1ID 2ID 3ID 4ID 5. Colours identify categories only; no lithology names are assigned.
SELECTED INTERVAL
UHR DETAIL · 1 CM WINDOW
Nearest readings within half each track’s sampling step. Missing or distant readings are shown as unavailable; values are not interpolated.




CoreDNA brings imagery together with selected measurements of rock strength, elemental composition and other physical properties. Aligning these observations helps guide sampling. A narrow dry-machined surface provides access for measurements before plugging and slabbing; this preparation removes some material and is agreed as part of the programme.
An interpretation programme can extend the measurement package with the following outputs, selected to suit the available data and project objectives:
Statistical groups require geological interpretation; they are not automatically validated lithofacies. Grain-size indices and modelled mineralogy are derived outputs, not substitutes for direct reference measurements. These analyses are scoped separately from routine acquisition.
Smart reports can bring imagery, measurements and interpretations into a navigable review format. Reporting scope is agreed alongside the analytical programme, with the underlying quantitative data retained for further use.
Extend the programme with sedimentological interpretation. Core photographs, selected CoreDNA measurements and available CT imagery can be reviewed together to define lithotypes, pick bed boundaries and examine how beds stack. Interpretive comments record the evidence and areas of uncertainty.
Where suitable borehole images are available, the scope can include core-to-log alignment, core orientation and assessment of sedimentary dips. These depend on the quality and processing of the reference data; uncertain orientation or depth matches remain explicit rather than being presented as definitive results.
Deliverables can include integrated interpretation panels, lithotype and bed-boundary records, and agreed image or data exports. This is an additional interpretation workstream, scoped separately from routine CoreDNA acquisition.
Explore geological integration ↗EXTEND THE PHYSICAL MEASUREMENT PROGRAMME
Add calibrated gamma-transmission density on suitable full-diameter core through a separately scoped logging programme. Acquisition at a permitted facility, specimen geometry and valid coverage are confirmed before testing.
P-wave velocity, loop-sensor magnetic susceptibility and total natural gamma can accompany the density programme. Supplied spectral gamma curves can be depth-matched for integration; total gamma is not spectral potassium, uranium and thorium measurement.
Use valid, depth-matched density, Vp and Vs to calculate dynamic Poisson ratio and Young’s, shear, bulk and constrained moduli. Acoustic impedance can be reported where the measurements can be reliably co-registered.
Prepared-core acquisition can be scoped at a suitable client facility, subject to access, utilities and handling arrangements. Record fractures, incomplete sections, poor contact and excluded measurements instead of filling gaps with assumed values.
These are complementary programme options, not additional CoreDNA sensor claims. Dynamic properties are laboratory-frequency outputs and require appropriate calibration before use as static engineering moduli. Acoustic-attenuation studies require separate method and feasibility agreement.
Explore staged predictive modelling ↗CTS is your point of contact for planning the programme and bringing the results together. Where specialist laboratory or interpretation input is required, delivery responsibilities are identified in your proposal.
The scope distinguishes the measurement package and its included outputs from additional processing, interpretation and interactive reporting. Sample requirements and method limitations are confirmed before work begins.
A CONNECTED WORKFLOW
Interpretation boundary
MiniSlab preparation removes a narrow layer of material; it is minimally invasive, not non-destructive. Sensor selection, calibration and sample suitability are agreed before acquisition. Grain-size estimates, mineralogical models and upscaled property tracks are distinguished from direct measurements.