SUBSURFACE ANALYSIS
& VISUALISATION
← All services

INTERPRET / SERVICE 11

Geological integration.

Bring core descriptions, CT imagery, analytical measurements and borehole information together to support geological interpretation.

THE QUESTION

How does core evidence fit the geological model?

Datasets often use different reference frames and scales. A consistent depth and sample framework supports meaningful comparisons of facies, structures and reservoir-quality variations.

Methods & applications

  • Sedimentological logging and facies interpretation
  • Core-to-log depth matching
  • CT–borehole image integration
  • Core orientation and structural interpretation
  • Integrated reservoir-quality assessment
  • Biostratigraphy and stratigraphic correlation
  • Depositional-environment and diagenetic interpretation
  • Wireline and borehole-image interpretation
  • Staged AI feasibility, validation and predictive modelling

CORE TO RESERVOIR

Put every observation
in geological context.

Connect what the rock looks like, how it was deposited and how its pore system has evolved. CTS brings core description, imaging and laboratory evidence into a consistent interpretation for clastic and carbonate reservoirs.

SEE THE CONNECTION

One rock. Different views.

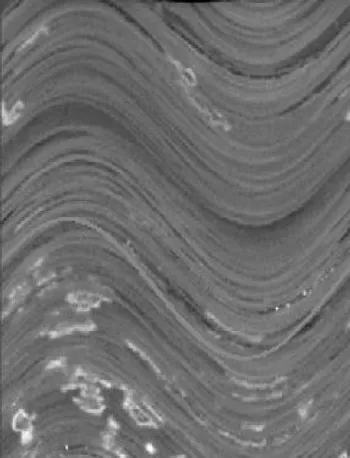
Compare the visible rock fabric with internal CT structure, then relate recognisable features to borehole images.

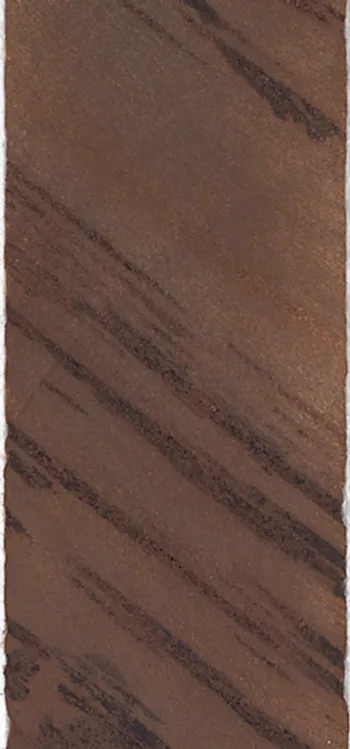
Core slab showing inclined sedimentary lamination
01 / CORE SLAB

Describe the fabric.

Surface observations establish the sedimentological context.

Unwrapped circumferential CT image showing curved traces of internal bedding
02 / CIRCUMFERENTIAL CT

Reveal internal structure.

Unwrapped CT imagery extends the view around the core.

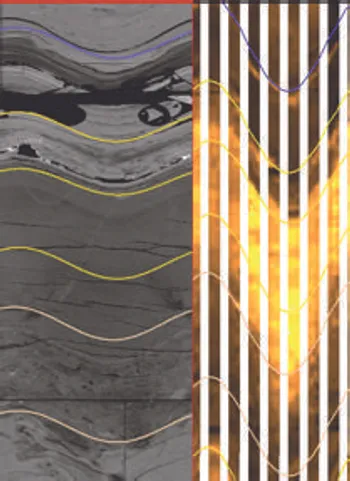
CT on the left compared with borehole imagery on the right, with coloured interpreted traces
03 / CT + BOREHOLE IMAGE

Match the features.

Corresponding traces support orientation and dip interpretation.

BEDDING TO ARCHITECTURE

Interpret how the beds stack.

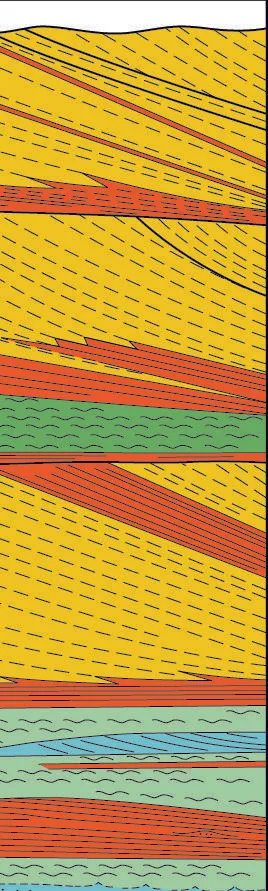
Bounding surfaces and stratification patterns help distinguish depositional elements and their internal geometry. These observations inform assessment of heterogeneity and possible flow pathways.

Avalanche strataWind-ripple strataSabkha

Colours follow the source interpretation; this is a geological interpretation, not a simulated flow result.

Interpreted stratification panel with inclined beds and bounding surfaces coloured by stratification type

Reference figures: © Badley Ashton, supplied CT/BHI aeolian-deposits case study. Views are presented separately, not as a common-scale aligned log.

01

Sedimentology & depositional architecture

Describe lithology, grain size, sedimentary structures and bed boundaries. Build facies associations and stacking patterns that connect core observations with depositional environments and reservoir geometry.

Interpreted core logs · facies schemes · key surfaces

02

Core–CT–borehole image integration

Combine core photographs, circumferential CT images and borehole images (BHI). Match recognisable features, reconcile depth and orientation, and examine bedding and bounding surfaces in their directional context.

Aligned image panels · orientation records · dip interpretation

03

Reservoir quality & rock typing

Integrate thin sections, SEM, XRD, routine core analysis and MICP to assess how texture, clay, cement and pore systems influence reservoir quality. Relate rock types to the sedimentological framework.

Rock-type schemes · property comparisons · geological controls

04

Structural characterisation

Review fractures, faults and deformation bands using core, CT and borehole images. Distinguish natural features from drilling-related damage where the evidence allows, and examine their relationship to mechanical stratigraphy.

Classified feature picks · fracture sets · structural panels

05

Correlation & reservoir architecture

Calibrate wireline responses against core observations and analytical results. Integrate stratigraphic evidence, map key surfaces and assess changes in facies, connectivity and potential flow barriers between wells.

Correlation panels · depositional concepts · model inputs

06

Cuttings & diagenetic interpretation

Where core is limited, combine cuttings petrography, mineralogy and wireline logs to constrain lithology and facies. Targeted cement and fluid-inclusion studies can investigate diagenetic history where suitable material is available.

Integrated descriptions · diagenetic sequences · interpretation reports

A CLOSER LOOK / CORE–CT–BHI

From separate images
to an oriented interpretation.

The value is in matching the evidence. Circumferential CT can reveal internal stratification; borehole images provide an orientation reference. Core description supplies the geological context for both.

  1. 01

    Establish the reference

    Review core recovery, image quality, log coverage and depth references.

  2. 02

    Align the evidence

    Splice CT sections, match features and record depth and relative rotation adjustments.

  3. 03

    Orient & interpret

    Use suitable BHI matches to reconstruct orientation to north and interpret geological features.

  4. 04

    Deliver the framework

    Export aligned panels, interpreted picks and a traceable record of assumptions.

Orientation requires recognisable, reliable matches. Poor recovery, disturbed core and variable image quality can leave intervals unresolved; those uncertainties remain part of the interpretation.
DELIVERABLES

A usable geological framework.

Outputs are selected around the decision—not simply the available tests. The programme can run from a focused single-well review to integrated multi-well interpretation.

  • Interpreted sedimentology logs and geological summary panels.
  • Depth-matched core, CT, BHI and wireline displays, with reoriented image exports where supported.
  • Facies, rock-type and fracture classifications linked to supporting observations.
  • Integrated petrographic, mineralogical and petrophysical interpretation.
  • Tabulated observations, correlation products and a technical report or review workshop.
Discuss your geological question ↗

AI INTEGRATION & PREDICTIVE MODELLING

Test feasibility before extending predictions.

Data readiness

Align core measurements, pXRF, wireline curves and suitable reference data. Review lithofacies coverage, define prediction targets and establish a blind-validation strategy. A readiness review does not deliver a predictive model.

Feasibility and go/no-go review

Develop initial models for selected properties such as porosity, permeability or facies where the inputs support them. Assess preliminary performance and uncertainty before deciding whether further development is justified.

Validated model development

Refine promising models, test against withheld reference data and quantify uncertainty. Any application to further core or another well requires a separate assessment of geological coverage and applicability.

Enhanced multi-property interpretation

Where supported by calibration data, extend the scope to density, strength, elastic properties or mineralogy. Deliver agreed prediction curves, figures and technical reporting with measured and modelled outputs kept distinct.

Predictive work depends on representative training and independent reference data. Mineralogical prediction may require XRD or QEMSCAN calibration. Delivery of curves or reports does not automatically include executable models or source code.

Connect rock typing with petrography ↗

A clearly scoped delivery.

CTS is your point of contact for planning the programme and bringing the results together. Where specialist laboratory or interpretation input is required, delivery responsibilities are identified in your proposal.

The scope distinguishes the measurement package and its included outputs from additional processing, interpretation and interactive reporting. Sample requirements and method limitations are confirmed before work begins.

A CONNECTED WORKFLOW

From question to evidence.

  1. 01

    Establish the common reference framework

  2. 02

    Align core and borehole evidence

  3. 03

    Interpret geological relationships

  4. 04

    Document conclusions and uncertainty

Interpretation boundary
Orientation and correlation depend on available data quality and coverage. Uncertain matches remain identified as uncertainties.